Cost
Smooth cost management and cost savings- these are the two major reasons because of which people opt for Azure. And Azure does help you immensely in this regard. But with convenience, comes some problems. Managing IT costs through Azure requires technical expertise. A CEO or CFO or any stakeholder in the company apart from the developers or project managers might find it hard to wade through the myriad of options to view and manage costs.
PowerBoard simplifies cost management in Azure. With PowerBoard, you can manage costs even if you are a non-technical person. PowerBoard doesn’t require you to click links upon links to give you information on the cloud spends. In fact, PowerBoard’s AI-based algorithm will find ways to help you save costs.
In this part of the documentation, you will learn -
- How PowerBoard helps you manage costs efficiently with no requirement of technical knowledge.
- How PowerBoard shows all the cost-related information right in front of your eyes - no need to dig deep.
- How you can save money using PowerBoard’s recommendations, and
- How you can avoid rude bill shocks in Azure.
Cost Management: An Overview
There are two ways you can manage and view costs in PowerBoard -
- The Homepage
- The ‘Cost’ link on the left pane
The Homepage of PowerBoard gives you a fairly detailed overview of the major cost-related aspects. So, you don’t have to click much to see how much money you have accrued and where all your money is going. On the other hand, the ‘Cost’ option on the left pane will give you a detailed description of the IT spends with all the bars and graphs.
Who Can Benefit From The Information
- Generally the finance department, the CFO or the CEO are the ones who are interested in knowing all the cost related information. And these people might not be cloud experts. They need a simple way to have a comprehensive cost report. PowerBoard gives them back the power to get all the cost related info without being dependent on the cloud experts. Anybody in the organisation can use PowerBoard to get a detailed picture of the cloud cost incurred by the organisation.
- The DevOps team or the cloud administrator can prevent billing shocks with the help of PowerBoard’s cost reports by finding anomalies in Azure. So a spike in the daily or monthly cost trend can be caught quickly with the help of PowerBoard. Before any significant damage happens the DevOps team can contain the root cause of the spike,
- Sometimes the increase in the cloud bill is a result of unauthorised provisioning by hackers. With PowerBoard’s daily and monthly cost report, this kind of cost spike can be caught early. Hence the CSO or the security team can look for any security breaches before much damage is done.
Part A: Cost Management Tools On The Homepage
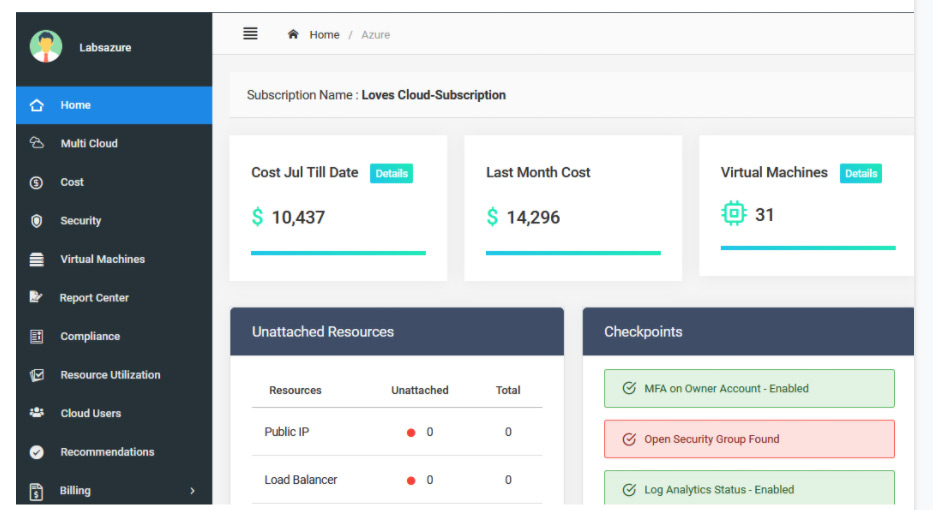
The homepage of PowerBoard includes the gist of all the cost-related information that matters most to you. Here is a list of the cost-related things that you can see on PowerBoard’s homepage -
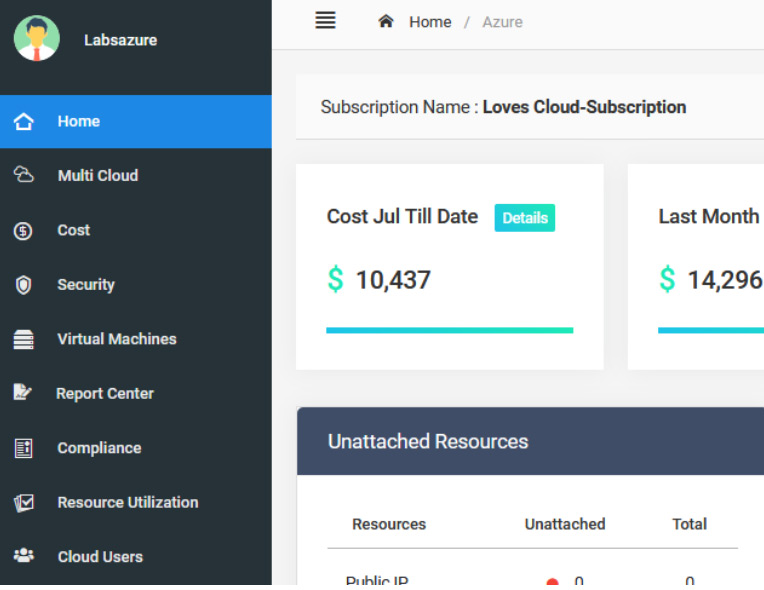
1. Cost Summary
The Homepage of PowerBoard greets you with a summary of the cost you have accrued - right at the top. You get to know -
- How much you have spent in the current month to date. (Just like MTD)
- How much you spent last month
How To Use This Information
This straightforward showcasing of cost accrued will save you some precious time. And time itself is money! You don’t need to spend time hunting for the simplest of the cost related details. With this summary of the month till date cost and the last month’s cost, you can get a clear picture of the current month’s forecast so far as the cost is concerned. You can gauge if your cost will remain the same as that of the last month. If you see that the current month’s cost is going to cross that of the last month, you can take actions to prevent that.
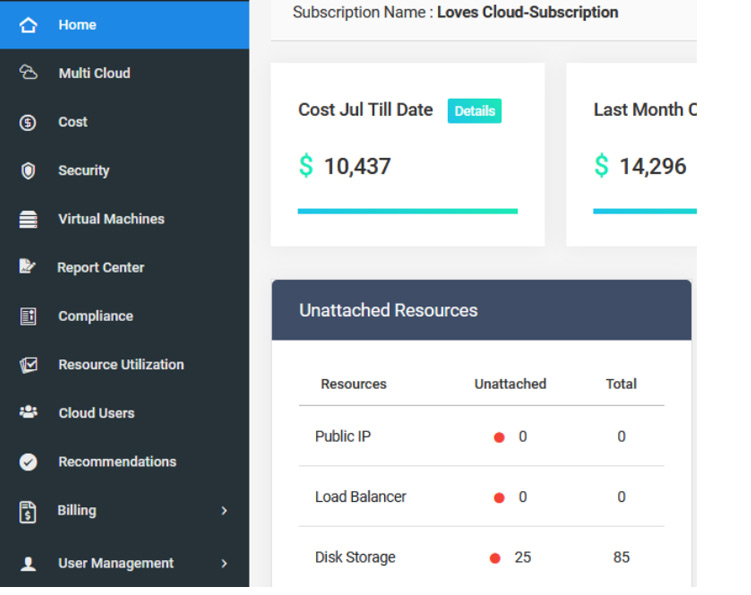
2. Unattached Resources
Just below the Cost Summary, you will find a list of unattached resources. You can find out from this list if you have any unattached public IP, Load Balancer or Disk Storage lying idle in your Azure account.
How You Can Use This Information
The information about unattached resources can save you a lot of money.
- In Azure, even if you dissociate a static IP address from a VM, that IP remains yours until you delete them. Hence, you keep on incurring charges for the unattached Static IP addresses. PowerBoard tells you how many such IP addresses are lying idle in your Azure account. You can delete them to save money. Static IP addresses cost you between $0.003 and $0.005 per hour.
- Unattached disks also keep incurring money. After you do away with a VM, the associated storage disk must be deleted separately. Azure does not automatically clean up these disks to avoid accidental data deletion. Oftentimes, people forget to remove the unattached storage disks. PowerBoard reminds you of such disks to help you save money.
- You also keep on paying money for the Load balancing rules and the associated data processing even if the associated VMs have been de-provisioned. So it is necessary to know if there are any load balancers that are lying idle. The Unattached Resources section of PowerBoard helps you in this regard.
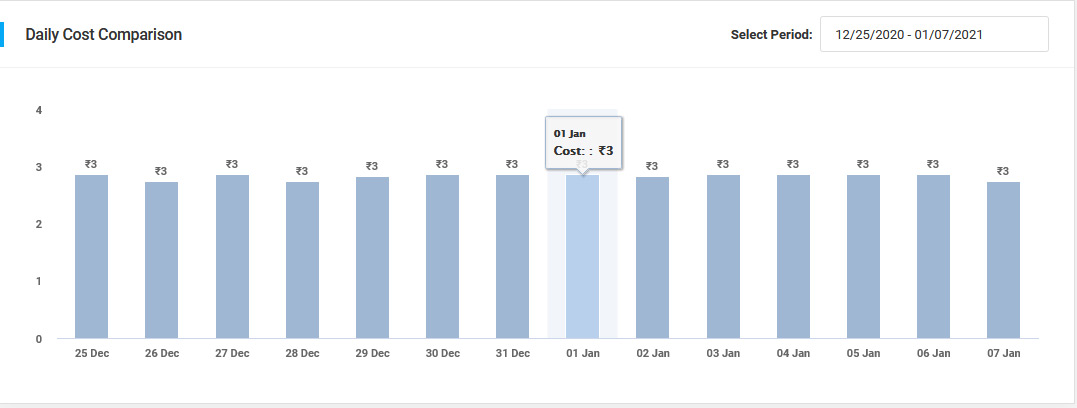
3. Daily Cost Comparison
On the homepage or dashboard of PowerBoard, you will find a trend of daily cost (Panel 5). You can see the daily cost incurred by you in the last 10 days. The trend is shown in the form of a bar chart. So you can easily find out if there was any cost-spike in 10 days.
How Can You Benefit From The Information
- The Daily Cost Comparison helps you see if there is an anomaly in the daily cloud expenses. So a CEO or CFO can take a cursory look at this bar chart and check if the average daily cost is uniform. If the CEO or Financial Officer finds out that on one day the daily cost was much higher than the rest of the 9 days, he can ask the cloud administrators what exactly happened that day. The cloud administrators will remain careful as well by knowing the fact that their daily task is accounted for.
- Cost is intrinsically connected with cloud security as well. If your Azure account gets hacked, one of the symptoms that you may notice is that you have got a huge bill. The hackers provision unauthorized VMs for their own nefarious purposes. It is important that you nip this incident in the bud. And that you can do by analysing the Daily Cost Comparison.
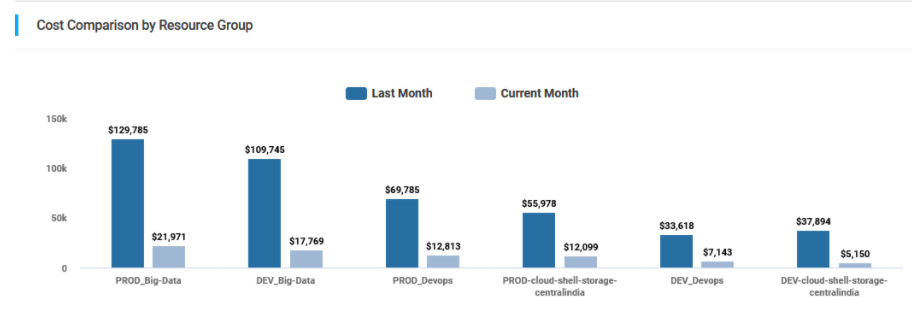
4. Cost Comparison by Resource Group
Just below the daily cost comparison, you will find a cost comparison based on the Resource Groups in your Azure account. You can compare the current month’s cost with that of the last month. This info is also shown in the form of a bar chart.
How You Can Use The Information
Resource Group is a nifty way of grouping together the same resources under one umbrella in Azure. So the resources used by the Dev Team can be held together in one group while the resources used by the Productions team are held together in another.
Now, PowerBoard’s Cost Comparison by Resource Group shows you how much cost is incurred by which Resource group separately. So one month, if you see the cloud cost has gone higher than expected ( by looking at the cost summary at the top of the page), you can pinpoint which division in your organisation spent the most amount of cloud budget - by looking at the Cost Comparison by Resource Group.
You Can Even See Which 5 Resource Groups Cost You The Most Amount Of Money by looking at the -
5. Spend By Top 5 Resource Groups
Take a look at the bottom-right corner of the homepage. You will find a pie chart showing you the top by Resource Group by Cost ( current month).
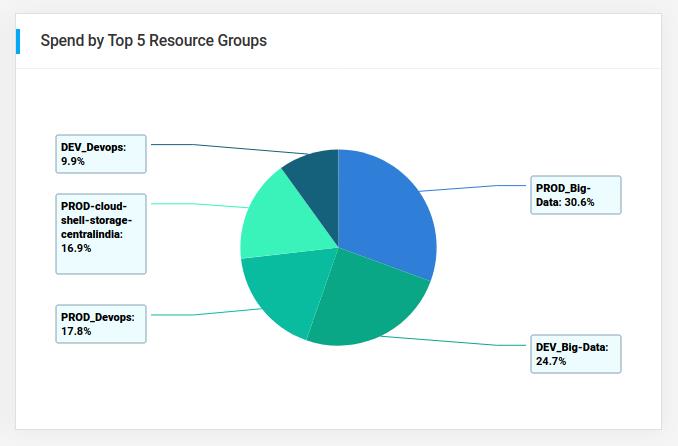
This visualization will help you understand quickly which Resource Group ( therefore which department) is proving to be most expensive.
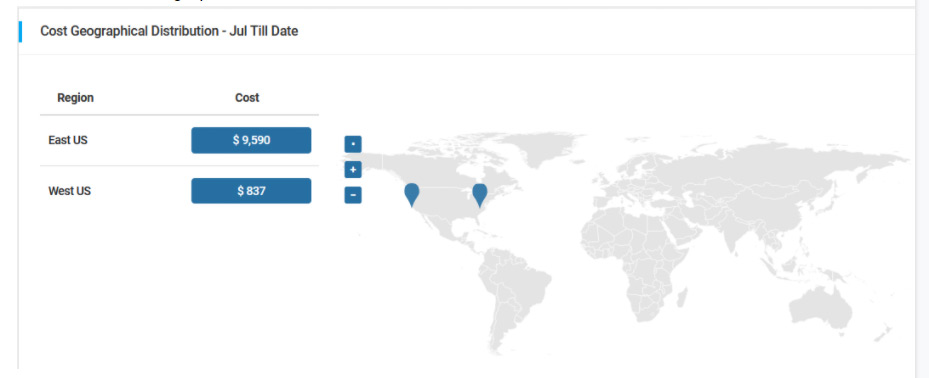
6. Cost Geographical Distribution - Month Till Date
Below the Cost Comparison by Resource Group section, you will find the Cost Geographical Distribution section that will show you exactly where your resources are provisioned. The interactive map helps you visualise the data in a comprehensive way.
How You Can Use The Information
This section of PowerBoard is useful not just for cost-monitoring purposes but also for compliance purposes.
Firstly, suppose there is an Indian company which does not have US customers to cater to. So if the CEO of the company sees through this tool in PowerBoard that there is a VM provisioned in the West US, he can quickly ask the cloud administrator “Hey why are we spending money on the West US region when we have no customers there?” So a CEO or CFO or anybody in the organisation can look for unutilised and unhelpful provisioning of resources using this section.
Secondly, due to various compliance rules - like GDPR - companies cannot provision VMs or Storage disks in certain locations other than the approved ones. This section of PowerBoard will show them if there are any resources that are provisioned outside of the approved regions.
Part B : Detailed Cost Management Tool On The Left Panel
Now that you know how to get a gist of all the major cost related info through the homepage, let’s delve deeper. Look at the left side of PowerBoard. You will see a menu with 10 options to click from. The second item on the left panel menu of PowerBoard will take you to the detailed cost reports section.
Click on the Cost link from the left menu. You will be transported to the main Cost dashboard.
Let’s talk about what this main Cost dashboard has to offer.
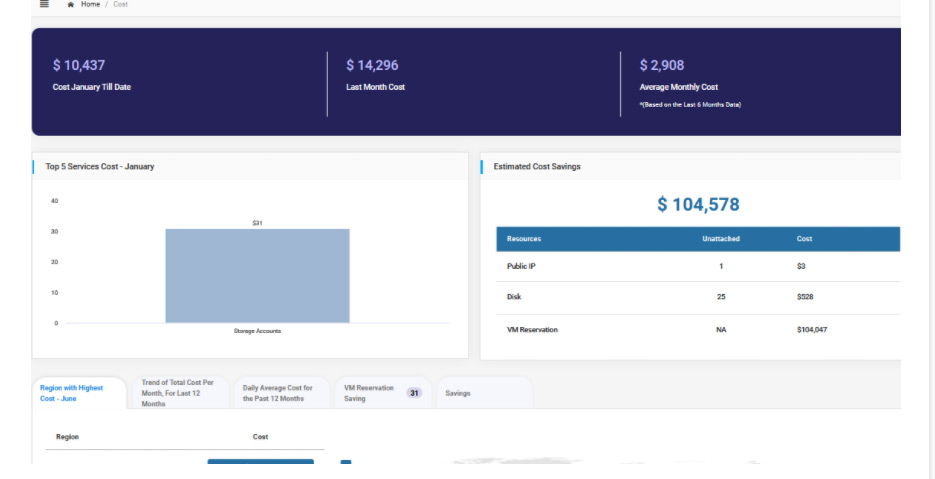
1. Detailed Cost Summary
At the top of this Cost dashboard, you will find a detailed cost report for your Azure account. This report consists of -
- Cost - Month Till Date
- Last Month Cost
- Average Monthly Cost
The first two parts of the cost report is available as a cost summary on the homepage as well. You can use this info to get a good idea about how much you have to pay Azure in the current month. You can also tally the current month’s report with that of the last month to forecast if the expenditure will remain more or less the same as the last month.
What is not there in the cost summary on the homepage is the Average Monthly Cost info. The Average Monthly Cost that you can see on the detailed cost report page takes into account the cost report of the last 6 months.
How You Can Use This Info
You can examine the Average Monthly Cost and tally that with the last month’s cost. As you can see from the figure above that the average monthly cost is Rs. 364,256. But last month’s cost was Rs. 401,661 which is quite higher than the average monthly cost.
Using this info you can stop the gradual rise in the cloud cost by getting aware of the issue before it goes out of hand.
2. Top 5 Services Cost - Current Month
Below the detailed cost summary, you will find a bar graph showing you the top resources that are costing you the most amount of money. You can even see exactly how much amount has been incurred by the usage of these resources.
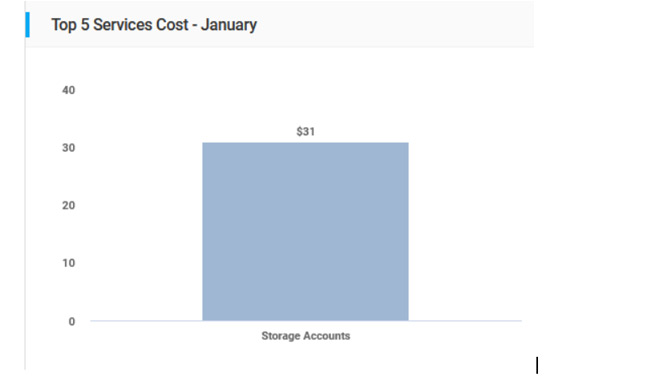
How You Can Use This Information
- It is very easy to know how much you have been charged by Azure. But when it comes to pinpointing exactly where your money went, it can get a little tricky. This part of PowerBoard solves this problem. You can see the itemised cost report.
- You can even look for anomalies by examining the bar chart. Normally, it is the virtual machines that cost the most amount of money. But if you find out that the bill for storage disks is more than that for the VMs, you can guess there is some kind of misconfiguration in your Azure account.
- Thirdly, you can separately keep track of the money that is consumed by the resources. So suppose, you see that the cost incurred by the usage of virtual machines is greater than that of the last month despite the fact that there has been no increase in the number of the virtual machines. You can then investigate to find out the reason behind this anomaly.
3. Estimated Cost Savings
Beside the Top 5 Services by Cost section, you will find the Estimated Cost Savings box. This box shows you the list of all the unattached resources that you have in your Azure account. You might be thinking that this info is already available on the homepage; so what is the use of this info here? Read on…
How You Can Use The Information
Unlike the homepage report on the unattached resources, this section does not just show you the list of unattached resources but it also shows you how much money these resources are costing you. So you can see how much money you can save by deleting these resources.
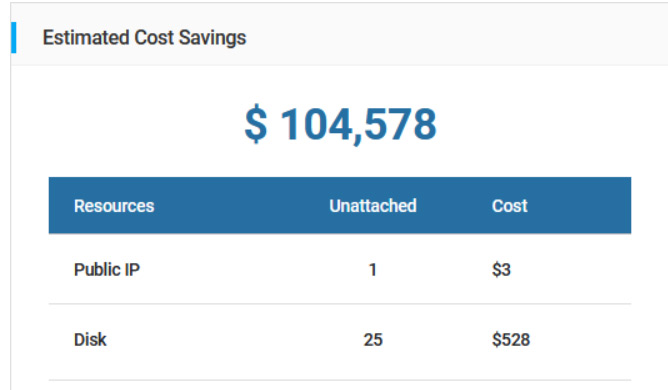
(You can even see the granular details of the unattached resources. Please see the last part of this Cost documentation)
4. Cost Report Tabs
At the bottom of the detailed cost reports page, you will find a box with 4 tabs. These 4 tabs show 4 different kinds of cost related data pertaining to your Azure account. The tabs are -
- Region With Highest Cost ( As per the last month’s report)
- Total Cost Per Month For Last 12 Months
- Daily Average Cost For The Last 12 Months
- Savings - Cost Savings Recommendations
Region With Highest Cost
This section is similar to the one that you will find on the homepage. This tab presents to you an interactive map that shows you in which Azure regions your resources are provisioned. Along with that, you get a list of region-wise cost summaries showing you the Azure regions that are costing you the most amount of money.
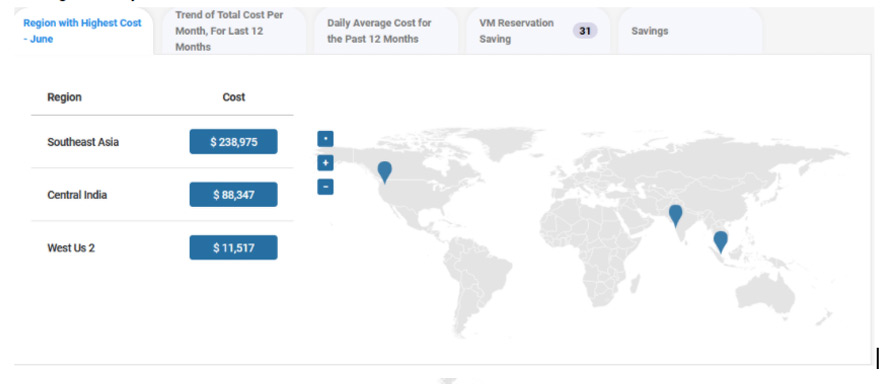
How You Can Use The Information
As said earlier, you can use this info to see if you have any resource provisioned in a region where you don’t have any clients to cater to. Furthermore you can look for potential breach in your Azure account by checking if there is any unauthorised provisioning done.
Trend Of Total Cost Per Month
The next tab will show you a trend of total cost incurred by you per month in the last 12 months - just like you can see the trend of daily cost on the homepage. The information is presented to you in the form of a line graph.
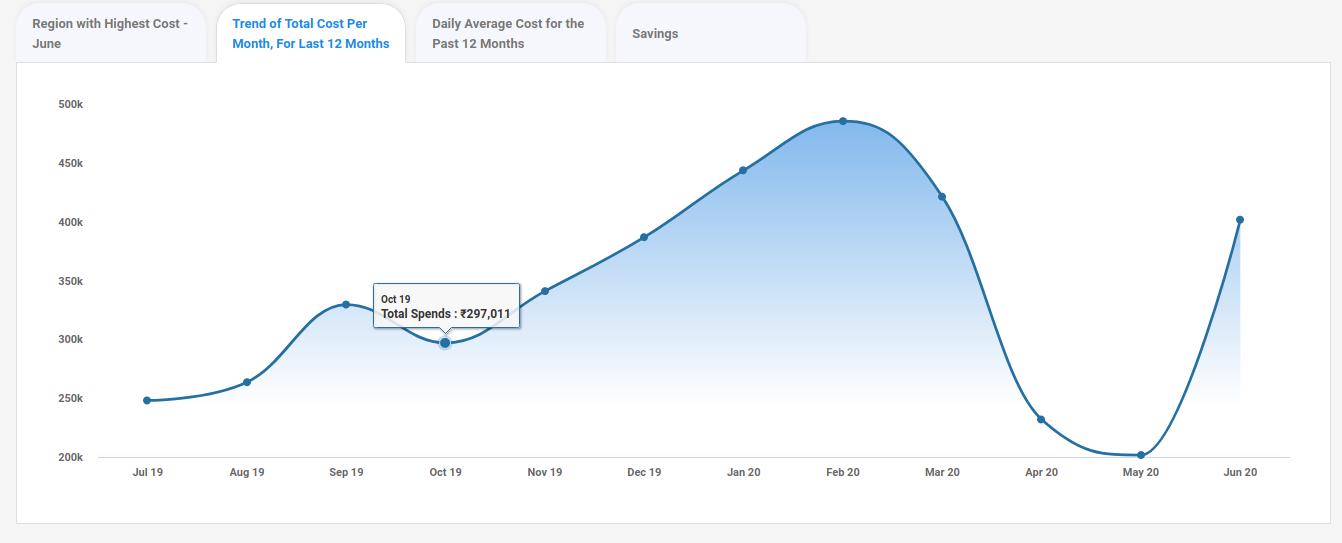
How You Can Use The Information
- Suppose Kathy is the CFO of a company. He wants to make sure that the expenses of the company do not go up month by month. So to see that the expenses are in control, all she has to do is to look at this line graph and see if the trend is more or less flat or if it is upward rising. If she sees that the trend is rising upward month by month, she can enquire what is going on and take timely action to stem the rise.
- At the same time, Sandra, the CEO of the company can look at the line graph, If she sees that in one particular month the trend went too low, she will assume that the business that month was not good. She can then enquire about the reason behind this slump to make sure that the company remains stable.
Daily Average Cost For The Past 12 Months
In the next tab, you will find a bar chart showing you the average daily cost incurred by you per month in the last 12 months. Do not confuse this with the daily cost report on the homepage. This, here, shows you the average daily cost incurred by you.
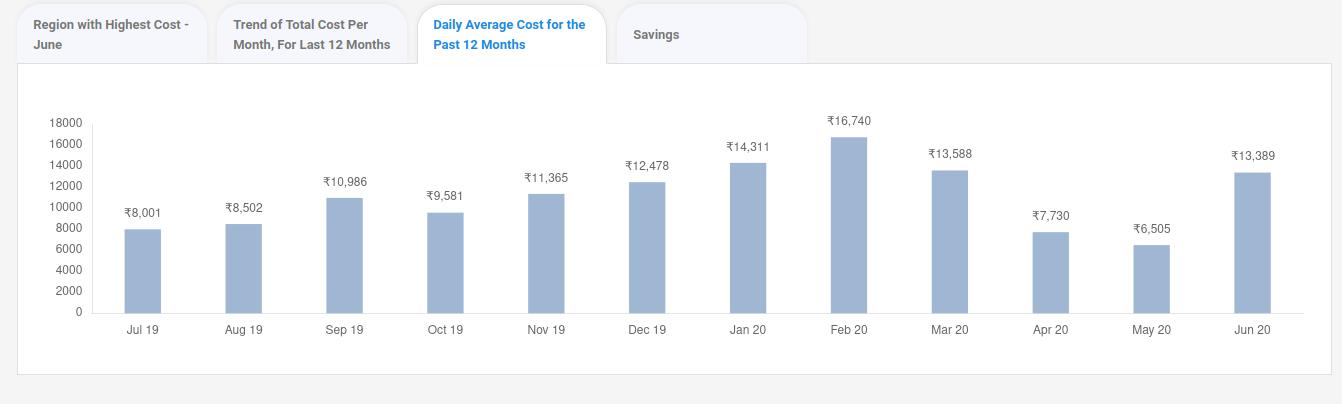
How You Can Use The Information
Just like the average monthly cost, the average daily cost will give you an idea on whether the cloud cost is going upwards or downwards. Furthermore, you can also tally the average daily cost with the actual daily cost to get real time knowledge about whether your daily cost is within the expected range.
Savings
The last tab will show you the list of unattached resources. But unlike other sections where you can see this kind of list of unattached resources, this one here is quite detailed.
The tab is further divided into two tabs - Unattached Disk and Unattached IP cost. The tabs will show you what disk ( disk name) under which resource group in which Azure region is unattached. Similarly, it will show you which IP address under which resource group in which Azure region is unattached.
The tab will show you exactly how much money each of these unattached resource groups is consuming.
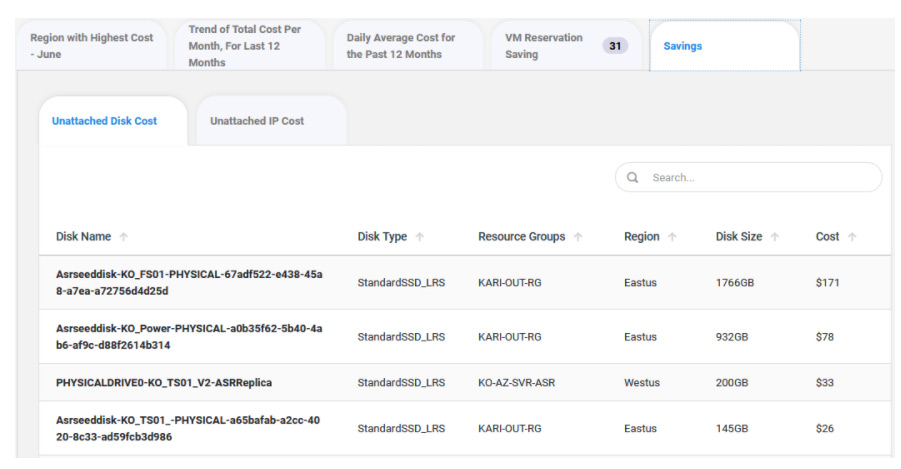
How You Can Use The Information
The USP of PowerBoard is that it gives actionable recommendations. In the earlier sections where you can find the list of unattached resources, you won’t find exactly which disk or which IP address is unattached. This section of PowerBoard pinpoints the exact unattached resources and shows you where you can find them. So you don’t need to dig down and find out the unattached resources. You can simply look for the location of the unattached resources by consulting this tab.
So, not only a cloud administrator but anybody in the organisation can easily find out the unattached resources.
With the help of these comprehensive cost management tools inside PowerBoard, it is next to impossible that you will face any billing shocks. You can see each and every cost related info right in front of you - no need to drill down. You also get to see the real time cost data. With PowerBoard’s vigilant monitoring, nobody will wake you up at 3am with any unfortunate billing report.